In the fast-paced world of project management, staying organized and on top of tasks is key to a successful outcome. One often overlooked tool that can greatly assist in achieving this is the network diagram. A network diagram is a visual representation of the flow and relationships between tasks, allowing project managers to analyze dependencies, identify critical paths, and allocate resources effectively. By understanding the importance of network diagrams, you can harness their power to streamline your project management process and ensure smooth project execution. So, let’s explore the value that network diagrams bring to the table.
Understanding the Importance of Network Diagrams in Project Management
Network diagrams are a vital tool in the world of project management. They serve as visual representations of a project, depicting the relationships and dependencies between activities. These diagrams illustrate the flow of activities and ensure clarity and understanding among project teams. In this article, we will explore the definition, purpose, key elements, benefits, types, and use cases of network diagrams in project management, providing you with a comprehensive understanding of their importance.
What is a Network Diagram?
Definition
A network diagram is a graphical representation of a project that depicts the relationships and dependencies between various activities. It highlights the logical flow and sequence of activities, enabling project managers and team members to understand how activities are connected and how they impact each other.
Visual Representation of a Project
At its core, a network diagram serves as a visual representation of a project. It outlines the structure and organization of activities, providing a clear overview of project scope and deliverables. By presenting the project in a graphical format, network diagrams make it easier for stakeholders to comprehend the project’s complexity and intricacies.
Depicting Relationships and Dependencies
One of the essential purposes of a network diagram is to illustrate the relationships and dependencies between activities. By connecting activities with arrows, the diagram showcases the sequence in which they need to be executed. This helps project teams understand the order in which activities should be performed to ensure a smooth and efficient workflow.
Illustrating the Flow of Activities
Network diagrams visualize the flow of activities within a project, showcasing the logical progression from start to finish. The diagram identifies the predecessors and successors for each activity, indicating how they are interconnected. This visual representation enables project managers to identify potential bottlenecks and determine the most effective sequencing of activities.
Ensuring Clarity and Understanding
By providing a clear and concise visual representation of a project, network diagrams promote clarity and understanding among project teams. They eliminate ambiguity and ensure that everyone involved in the project has a shared understanding of the project’s structure, dependencies, and critical path. This facilitates effective communication and collaboration, leading to better project outcomes.

The Purpose of Network Diagrams in Project Management
Network diagrams serve multiple purposes in project management. Let’s explore the key objectives they help achieve:
Understanding the Project Scope
Network diagrams help project managers and stakeholders gain a comprehensive understanding of the project’s scope. By visually representing the project’s activities and their relationships, network diagrams provide a holistic view of the project’s intricacies and deliverables.
Identifying Critical Path
The critical path of a project is the sequence of activities that will take the longest time to complete and determines the project’s overall duration. Network diagrams enable project managers to identify the critical path by analyzing the dependencies and durations of activities. This helps in resource planning and ensures that project timelines are met.
Estimating Project Duration
By analyzing the relationships and durations of activities, network diagrams assist in estimating the project’s duration. Project managers can identify the activities that might cause delays and take necessary actions to mitigate risks. Accurate project duration estimation helps allocate resources effectively and set realistic expectations for project stakeholders.
Allocating Resources
Network diagrams provide project managers with insights into resource allocation. By identifying the dependencies between activities, managers can allocate resources efficiently, ensuring that they are available when needed. This prevents resource conflicts and enables maximum utilization of available resources.
Managing Dependencies
Dependencies between activities are a crucial aspect of project management. Network diagrams help visualize these dependencies, ensuring that activities are sequenced correctly to avoid disruptions. By managing dependencies effectively, project managers can streamline project execution and prevent delays.
Reducing Risks and Uncertainties
Network diagrams play a vital role in risk management. By visually representing the flow of activities and their dependencies, project teams can identify potential risks and uncertainties. This allows for proactive risk mitigation strategies and ensures that the project progresses smoothly.
Enhancing Communication
Clear communication is essential for successful project management. Network diagrams provide a visual language that enhances communication among project teams and stakeholders. By providing a common understanding of the project’s structure and dependencies, network diagrams facilitate effective communication and collaboration.
Facilitating Decision Making
Network diagrams provide project managers with valuable insights that aid in decision-making. By analyzing the dependencies and critical path, managers can make informed decisions about resource allocation, sequencing of activities, and risk mitigation strategies. This ensures that projects stay on track and deliver the desired outcomes.
Key Elements of a Network Diagram
To understand network diagrams fully, it is essential to familiarize yourself with their key elements. Let’s explore each element in detail:
Nodes
In a network diagram, nodes represent the various activities or tasks within a project. Each node represents a specific activity that needs to be completed. Nodes are usually depicted as circles or rectangles, and their placement within the diagram signifies their sequence in the project’s flow.
Activities
Activities are the individual tasks or work packages that need to be completed as part of a project. They can be depicted as lines connecting the nodes within the network diagram. Each activity has a specific duration and may have dependencies on other activities.
Dependencies
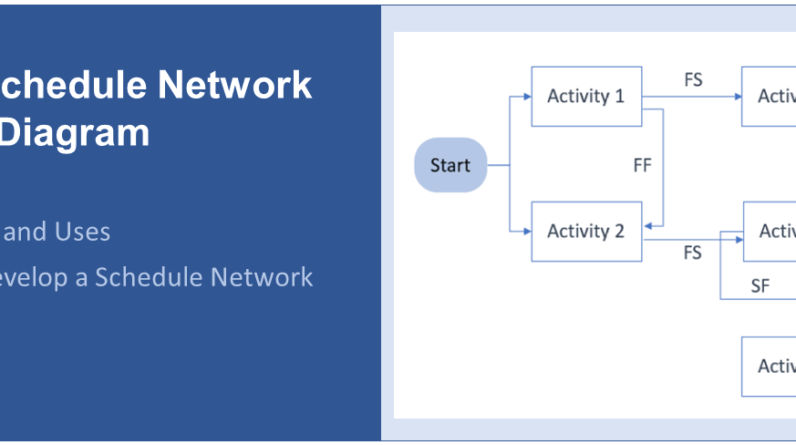
Dependencies represent the relationships between activities. They indicate the order in which activities should be executed. There are four types of dependencies commonly used in network diagrams:
- Finish-to-Start (FS) – The dependent activity cannot start until the preceding activity is finished.
- Start-to-Start (SS) – The dependent activity cannot start until the preceding activity has started.
- Finish-to-Finish (FF) – The dependent activity cannot finish until the preceding activity has finished.
- Start-to-Finish (SF) – The dependent activity cannot finish until the preceding activity has started.
These dependencies play a vital role in determining the critical path and sequencing of activities.
Critical Path
The critical path is the longest sequence of dependent activities in a network diagram. It determines the minimum timeframe required to complete the project. The critical path helps project managers identify the activities that must be completed on time to prevent delays in project delivery.
Float/Slack
Float, also known as slack, refers to the amount of time an activity can be delayed without impacting the project’s overall duration. Activities on the critical path have zero float since any delay in these activities will directly impact the project’s timeline. Activities with float can be delayed without affecting the project’s completion date.
Milestones
Milestones represent significant events or achievements within a project. They are often depicted as diamond-shaped nodes in the network diagram. Milestones help project teams track progress and provide a sense of accomplishment as they reach key points in the project timeline.
By understanding these key elements, project managers can effectively analyze and interpret network diagrams, leading to better project planning and execution.

Benefits of Using Network Diagrams
Network diagrams offer numerous benefits for project management. Let’s explore the advantages of using network diagrams:
Visual Representation
One of the significant benefits of network diagrams is their visual representation of a project’s structure. By presenting the project in a graphical format, network diagrams make it easier to understand complex relationships and dependencies. Visual representations promote clarity and comprehension, enabling stakeholders to grasp the project’s intricacies quickly.
Identifying Critical Path
Network diagrams play a crucial role in identifying the critical path. By analyzing the dependencies and durations of activities, project managers can determine the sequence of activities that must be completed on time. This helps in resource allocation and ensures that deadlines are met, preventing costly delays.
Efficient Resource Allocation
By visualizing dependencies and sequencing of activities, network diagrams assist in efficient resource allocation. Project managers can identify the activities that require specific resources and ensure that resources are available when needed. This prevents resource conflicts and optimizes resource utilization, leading to cost savings and improved project efficiency.
Understanding Dependencies
Network diagrams highlight the dependencies between activities, providing project teams with a clear understanding of how activities are related. This enables teams to identify any potential bottlenecks or constraints that may hinder project progress. Understanding dependencies helps project managers allocate resources effectively and establish a realistic project schedule.
Effective Risk Management
Network diagrams aid in effective risk management by visualizing the flow of activities and their interdependencies. Project teams can identify potential risks and uncertainties, allowing them to develop proactive risk mitigation strategies. By addressing potential risks in advance, project managers can minimize their impact and increase the chances of project success.
Improved Communication
Clear and effective communication is essential for successful project management. Network diagrams provide a visual language that enhances communication among project teams and stakeholders. By presenting the project structure and dependencies in a graphical format, network diagrams facilitate better understanding and collaboration, leading to improved project outcomes.
Enhanced Decision Making
Network diagrams support informed decision-making by providing valuable insights into project dependencies and critical path analysis. Project managers can make data-driven decisions regarding resource allocation, activity sequencing, and risk mitigation strategies. This ensures that projects stay on track and deliver the desired outcomes within the set timelines.
Optimized Project Planning
By visualizing the project flow and dependencies, network diagrams optimize project planning. Project managers can analyze the critical path, identify potential delays, and allocate resources efficiently. This results in a well-structured and realistic project plan, increasing the chances of project success.
The Types of Network Diagrams
There are several types of network diagrams used in project management. Let’s explore the most common types:
Precedence Diagramming Method (PDM)
The Precedence Diagramming Method (PDM) is a type of network diagram that uses boxes to represent activities and arrows to represent dependencies. PDM is highly flexible and allows for the inclusion of multiple dependencies between activities. It is widely used in modern project management methodologies, such as Agile.
Arrow Diagramming Method (ADM)
The Arrow Diagramming Method (ADM), also known as the Activity-on-Arrow (AOA) method, represents activities as arrows and events as nodes. ADM is commonly used in critical path analysis and aims to identify the most efficient sequence of activities to complete a project.
Critical Path Method (CPM)
The Critical Path Method (CPM) is a network diagramming technique that focuses on identifying the critical path – the longest sequence of dependent activities in a project. CPM helps project managers determine the minimum duration required to complete a project and allows for effective resource allocation.
Program Evaluation Review Technique (PERT)
The Program Evaluation Review Technique (PERT) is a network diagramming method that incorporates uncertainty and variability in activity durations. PERT calculates activity durations using three estimates – optimistic, pessimistic, and most likely. It is particularly useful when activities have a high degree of uncertainty.
Conditional Diagramming Method (CDM)
The Conditional Diagramming Method (CDM) is a network diagramming technique that allows for the representation of conditional and parallel activities. CDM is commonly used when project activities can be executed simultaneously or when certain activities depend on the completion of specific conditions.
These different types of network diagrams cater to different project requirements and methodologies, providing project managers with the flexibility to choose the approach that best suits their needs.

Gantt Chart vs. Network Diagram
When it comes to project planning and scheduling, both Gantt charts and network diagrams play significant roles. Let’s compare these two tools:
Definition and Purpose
A Gantt chart is a horizontal bar chart that visually represents project tasks, their durations, and their interdependencies. It provides a timeline view of the project and allows project managers to track progress and identify potential delays. On the other hand, a network diagram visually represents the flow and dependencies between activities, showcasing the logical sequence of tasks.
Visual Presentation
Gantt charts present project tasks and their durations in a sequential manner, displaying them on a timeline. They offer a clear overview of project progress and help project managers monitor the completion status of tasks. Network diagrams, on the other hand, focus on the relationships and dependencies between activities and provide a visual representation of project flow.
Level of Detail
Gantt charts offer a high level of detail, displaying individual tasks along with their durations, dependencies, and progress. They are widely used for day-to-day project tracking and monitoring. Network diagrams, however, provide a higher-level view, showcasing the flow and dependencies between activities rather than specific task details.
Focus on Time
Gantt charts emphasize time by presenting tasks on a timeline. They enable project managers to track project progress against predetermined schedules and identify any deviations. Network diagrams, on the other hand, highlight the logical flow and sequencing of activities, helping project managers understand the relationships and dependencies between tasks.
Complexity and Scalability
Gantt charts are well-suited for smaller projects with a limited number of tasks and dependencies. They can quickly become cluttered and difficult to read when used for larger and more complex projects. Network diagrams, on the other hand, handle complexity and scalability more effectively, making them suitable for projects with numerous activities and dependencies.
Both Gantt charts and network diagrams have their benefits and serve different purposes in project management. Project managers often use them in conjunction to achieve a comprehensive view of project planning, scheduling, and progress tracking.
Common Symbols and Notations in Network Diagrams
Network diagrams utilize specific symbols and notations to represent various elements. Let’s explore the common symbols and notations used:
Nodes
Nodes in a network diagram are typically depicted as circles or rectangles. Each node represents a specific activity within the project. The placement of nodes within the diagram signifies the sequence in which activities should be executed.
Activities
Activities in a network diagram are represented by lines or arrows connecting the nodes. The length of the line or arrow corresponds to the duration of the activity. The label next to the line or arrow usually describes the activity or task being performed.
Arrows
Arrows in a network diagram represent the dependencies between activities. They indicate the flow and sequencing of activities, showcasing which activities must be completed before others can start.
Dangling Activities
Dangling activities refer to activities that do not have any successor or dependency. These activities are typically represented by nodes without any outgoing arrows. Dangling activities can impact the project schedule and should be carefully examined.
Milestones
Milestones are significant events or achievements within a project. They represent key points in the project timeline and are often depicted as diamond-shaped nodes. Milestones help project teams track progress and provide a sense of accomplishment as they reach important project milestones.
Constraints
Constraints represent limitations or restrictions on activities within a project. They are usually indicated by specific symbols or notations and restrict the scheduling or sequencing of activities. Constraints may arise due to resource availability, external dependencies, or other project-specific factors.
By understanding these symbols and notations, project teams can effectively interpret and analyze network diagrams, enhancing their project management capabilities.

Steps to Create a Network Diagram
Creating a network diagram involves several steps that ensure accurate representation and effective utilization. Let’s explore the key steps to create a network diagram:
Identify Project Activities
The first step in creating a network diagram is to identify all the activities that need to be completed within the project. Create a list of tasks and determine their specific requirements and dependencies.
Determine Dependencies
Once the activities are identified, determine the dependencies between them. Identify which activities must be completed before others can start. Classify the dependencies as finish-to-start (FS), start-to-start (SS), finish-to-finish (FF), or start-to-finish (SF).
Define Duration and Sequence
Assign durations to each activity based on their estimated completion time. Determine the sequence in which activities need to be executed, considering their dependencies. This will help establish the logical flow of activities within the network diagram.
Construct the Network Diagram
Using the identified activities, dependencies, durations, and sequence, construct the network diagram. Start by drawing the nodes representing each activity and connect them with arrows to showcase the dependencies. Ensure that the diagram accurately represents the project’s flow and sequencing.
Analyze the Critical Path
Analyze the network diagram to identify the critical path – the sequence of activities that will take the longest time to complete. Determine the total duration of the critical path and identify any activities with zero float or slack. The critical path will help project managers make informed decisions about resource allocation and project scheduling.
Update and Monitor
Once the network diagram is constructed, regularly update it to reflect any changes or progress in the project. Monitor the project’s execution against the network diagram and make necessary adjustments as required. This will ensure that the network diagram remains an accurate representation of the project’s status.
By following these steps, project managers can create effective network diagrams that serve as powerful tools for project planning and management.
Examples of Network Diagrams
Network diagrams come in various forms, depending on the complexity and requirements of the project. Here are two examples of network diagrams:
Example 1: Simple Network Diagram
In a simple network diagram, activities are represented by nodes, and dependencies are shown through arrows. Each activity has a duration, and the diagram showcases the flow of activities from start to finish. This type of diagram is often used for smaller projects with a limited number of activities and dependencies.
(Start) --> Task 1 --> Task 2 --> Task 3 --> (Finish) In this example, Task 2 cannot start until Task 1 is completed. Similarly, Task 3 cannot start until Task 2 is completed. The arrows indicate the sequence of activities, showcasing their dependencies.
Example 2: Complex Network Diagram
In a complex network diagram, the project may have multiple paths, parallel activities, and conditional dependencies. The diagram showcases the interconnections between activities and allows for a comprehensive understanding of the project flow.
(Task A) --> (Task B) --> (Task C) --> (Task D) (Task E) --> (Task F) --> (Task G) --> (Task H) (Task A) --> (Task F) --> (Task D) In this example, multiple paths are present, with each path representing a different sequence of activities. The network diagram allows project teams to visualize and understand the complexity and interdependencies within the project.
These examples demonstrate how network diagrams can represent different project structures and dependencies, enabling project teams to plan and execute their projects effectively.

Tips for Effective Use of Network Diagrams
To maximize the benefits of network diagrams, consider the following tips:
Keep it Clear and Concise
Ensure that your network diagram is clear and easy to understand. Use standard symbols and notations to represent activities, dependencies, and milestones. Avoid cluttering the diagram with unnecessary details, focusing on the critical elements that convey the project’s flow and sequencing effectively.
Use Standard Symbols and Notations
Adhere to industry-standard symbols and notations when creating network diagrams. This promotes consistency and ensures that the diagram can be easily interpreted by project teams and stakeholders. Using standard symbols also allows for seamless collaboration and communication among project teams.
Regularly Update and Maintain
Network diagrams should be regularly updated to reflect any changes or progress in the project. As activities are completed, dependencies change, or new milestones are reached, ensure that the diagram accurately represents the current state of the project. Regular maintenance of the diagram helps project teams stay on track and prevent any confusion or misunderstandings.
Involve Project Team Members
Network diagrams are effective tools for collaboration and communication. Involve project team members in the creation and review of the network diagram. This promotes a shared understanding of the project structure and fosters buy-in and ownership from the team. Including team members also allows for valuable insights and inputs, leading to a more comprehensive and accurate network diagram.
Ensure Stakeholder Understanding
Network diagrams are not just internal project management tools; they are also valuable communication tools with stakeholders. When sharing the network diagram with stakeholders, ensure that it is presented in a clear and easily understandable format. Explain the symbols and notations used and provide context to help stakeholders grasp the project’s structure and dependencies.
By following these tips, project managers can effectively use network diagrams to plan, communicate, and manage their projects, increasing the chances of successful project outcomes.
In conclusion, network diagrams play a crucial role in project management by providing a visual representation of a project’s structure, dependencies, and flow. They facilitate understanding, enhance communication, and aid in effective decision-making. By utilizing network diagrams, project managers can optimize project planning, execution, and resource allocation. Understanding the importance of network diagrams empowers project teams to effectively manage their projects, leading to successful and timely project delivery.