
Whether you’re a seasoned project manager or just starting out, it’s important to have a clear understanding of network diagrams in project management. These diagrams are powerful tools that visually represent the relationships between different tasks and activities within a project. By depicting the flow and dependencies of tasks, network diagrams provide a comprehensive overview of the project’s timeline and help identify critical paths. In this article, we will explore the concept of network diagrams and how they play a crucial role in managing projects efficiently. So, buckle up and get ready to unravel the mysteries of network diagrams!
Understanding Network Diagrams in Project Management
Definition of a Network Diagram
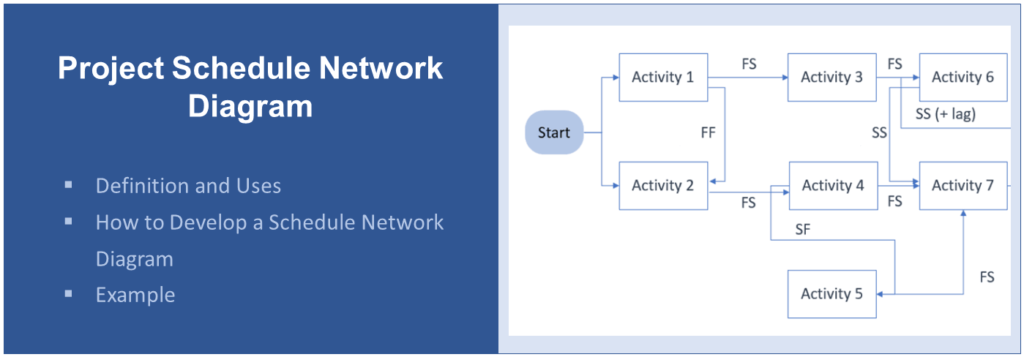
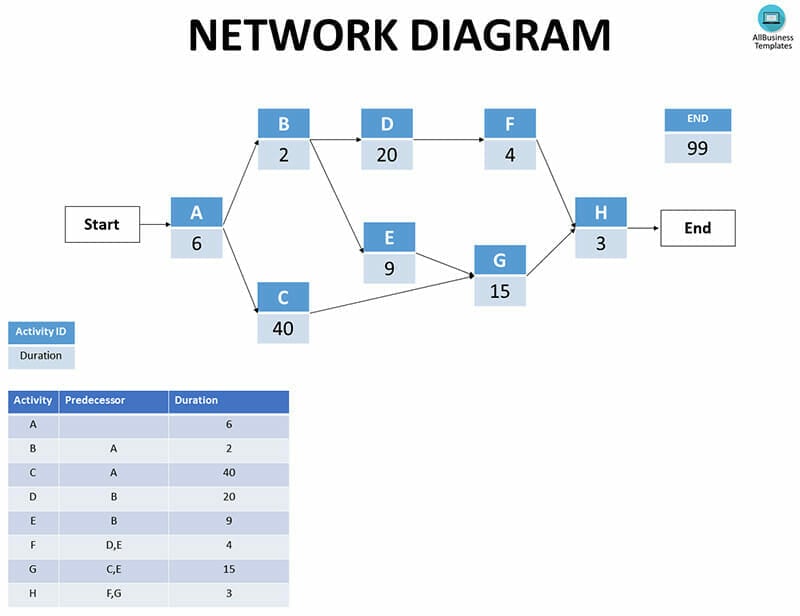
A network diagram in project management is a visual representation of the project’s activities, dependencies, and the sequence in which they need to be completed. It is a graphical tool that helps project managers and teams understand the flow of work, identify critical paths, and plan project activities effectively. Network diagrams can be created using different methods such as the Critical Path Method (CPM) or the Program Evaluation and Review Technique (PERT).
Purpose of Network Diagrams
The primary purpose of network diagrams in project management is to provide a clear and visual representation of the project’s timeline, tasks, and relationships between different activities. By mapping out these details, network diagrams enable project managers to gain insight into the project’s complexities, identify potential bottlenecks, and optimize the project plan.
Network diagrams also serve as a communication tool among project team members, stakeholders, and other relevant parties. They help in conveying project information and objectives in a concise and easily understandable manner. Additionally, network diagrams can assist in estimating project timelines, identifying critical activities, and allocating resources effectively.
Components of a Network Diagram
A network diagram consists of several key components that work together to provide a comprehensive representation of the project plan. These components include:
-
Nodes (also referred to as vertices): Nodes represent the tasks or activities within the project. Each node is represented by a box or a circle and is labeled with a unique identification number.
-
Arrows (also known as edges): Arrows represent the dependencies and relationships between different tasks. They connect the nodes and indicate the flow of work from one activity to another.
-
Duration: Each activity in the network diagram is assigned a duration, which represents the time required to complete that specific task.
-
Milestones: Milestones are significant events or achievements within the project. They are represented as diamonds in the network diagram and help track the progress of the project.
-
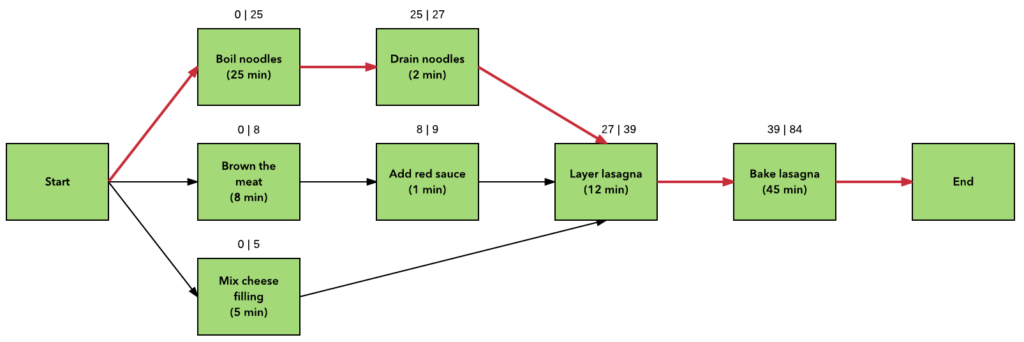
Critical Path: The critical path is the longest sequence of dependent activities that determine the overall duration of the project. It represents the minimum time required to complete the project.
Types of Network Diagrams
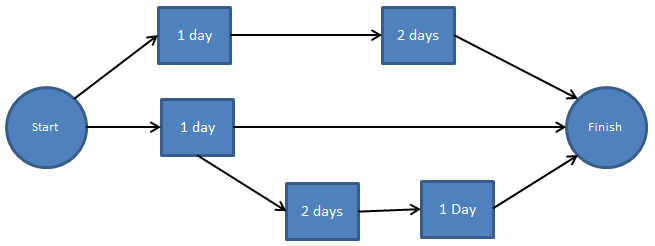
There are two main types of network diagrams commonly used in project management: the Activity-on-Node (AON) diagram and the Activity-on-Arrow (AOA) diagram.
-
Activity-on-Node (AON) Diagram: In an AON diagram, the activities are represented by nodes, and the arrows represent the dependencies between the activities. This type of diagram allows for easy identification of the critical path and provides a clear visualization of the project’s timeline.
-
Activity-on-Arrow (AOA) Diagram: In an AOA diagram, the activities are represented by arrows, and nodes represent the events or milestones. This type of diagram focuses on the relationships between events and is often used in conjunction with the PERT technique.
Both types of diagrams have their advantages and can be used depending on the specific project requirements and preferences.
Traditional Network Diagram vs. Agile Network Diagram
While network diagrams are commonly used in traditional project management methodologies, their usage extends to Agile project management approaches as well. However, there are some notable differences between the traditional and agile network diagrams.
In traditional project management, network diagrams are often created using the Critical Path Method (CPM) and mainly focus on time-based dependencies. The emphasis is on planning and sequencing activities to ensure the project is completed on time.
In contrast, Agile network diagrams prioritize collaboration, flexibility, and adaptability. They are often created using Agile-specific tools and methodologies, such as Kanban boards or Scrum boards. Agile network diagrams place more emphasis on visualizing the flow of work, tracking progress, and allowing teams to self-organize and make real-time adjustments.
Using Network Diagrams for Project Planning
Network diagrams play a crucial role in project planning by helping project managers and teams develop a detailed understanding of the project’s structure and timeline. They allow for a visual representation of the project, enabling better communication, coordination, and decision-making.
Project planning using network diagrams involves the following steps:
-
Identifying Activities: The first step is to identify all the necessary activities required to complete the project. Each activity should be specific and have well-defined objectives.
-
Sequencing Activities: Once the activities are identified, the next step is to determine the dependencies and relationships between them. This involves identifying which activities must be completed before others can start.
-
Estimating Durations: Project managers and teams need to estimate the duration of each activity accurately. This helps in determining the overall project timeline and identifying critical activities.
-
Creating the Network Diagram: Using the identified activities, dependencies, and durations, project managers create the network diagram. This diagram provides a visual representation of the project’s flow, critical paths, and milestones.
-
Analyzing Critical Path: By analyzing the network diagram, project managers can identify the critical path—the path with the longest duration. The critical path reveals the activities that must be closely monitored to ensure the project’s timely completion.
Creating a Network Diagram
Creating a network diagram requires careful planning and consideration of the project’s activities and dependencies. Here is a step-by-step guide to creating a network diagram:
-
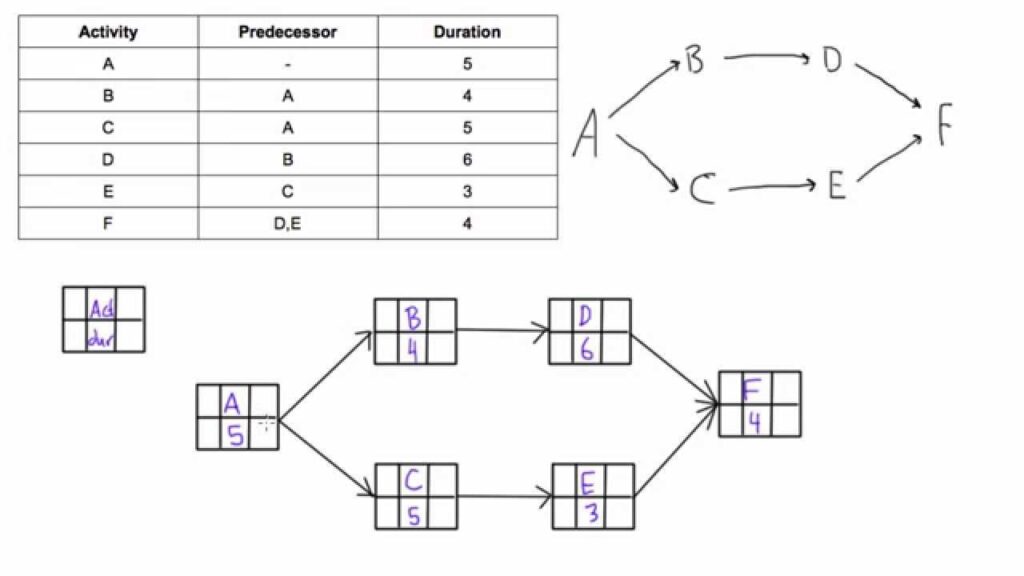
Identify the activities involved in the project: Begin by listing all the activities or tasks that need to be completed to accomplish the project objectives. Ensure that each activity is specific, measurable, achievable, relevant, and time-bound (SMART).
-
Determine the dependencies: Analyze the relationships between the activities and determine their dependencies. Some activities can start only when certain prerequisites are completed, while others can run concurrently. This information will help you establish the sequence and connections in the network diagram.
-
Assign durations to activities: Estimate the time required to complete each activity. Consult with the project team, subject matter experts, and historical data to gather accurate estimates. These durations will be used to create the timeline in the network diagram.
-
Create the network diagram: Begin by creating nodes for each activity and labeling them with their corresponding identification numbers. Use arrows to connect the dependent activities, indicating the flow of work. Add milestones and critical path information to enhance the clarity and effectiveness of the diagram.
-
Review and refine the network diagram: Once the network diagram is complete, review it for accuracy, completeness, and logical flow. Make any necessary adjustments or refinements to ensure that the diagram accurately represents the project plan and is easy to comprehend.
Critical Path Method
The Critical Path Method (CPM) is a project management technique commonly used in conjunction with network diagrams. It helps in identifying the critical activities and determining the minimum time required to complete the project.
The critical path can be determined by following these steps:
-
Calculate the earliest start and finish times for each activity: Start by assigning the earliest start time of 0 to the first activity. Then, calculate the earliest finish time for each subsequent activity by adding its duration to the earliest start time.
-
Calculate the latest start and finish times for each activity: Start with the latest finish time of the last activity and subtract the durations of the activities to calculate the latest start times. Repeat this process for each preceding activity.
-
Determine the float or slack of each activity: The float or slack of an activity is the amount of time it can be delayed without delaying the project’s overall duration. It can be calculated by subtracting the earliest start time from the latest start time.
-
Identify the activities with zero float: The activities with zero float are the critical activities as they directly impact the total duration of the project. The critical path is determined by connecting these critical activities.
Benefits of Network Diagrams in Project Management
Network diagrams offer several benefits in project management:
-
Visual Representation: Network diagrams provide a clear and visual representation of the project’s structure, flow, and critical paths. This visual representation helps project managers and teams comprehend complex project relationships and dependencies more easily.
-
Improved Coordination: By visually mapping out the project activities and their dependencies, network diagrams facilitate better coordination among project team members, stakeholders, and other relevant parties. They help ensure that everyone understands the project plan and contributes effectively.
-
Efficient Resource Allocation: Network diagrams assist in identifying resource requirements for each activity and highlight potential resource constraints. This allows project managers to allocate resources efficiently and mitigate any potential bottlenecks or overutilization of resources.
-
Accurate Time Estimation: By considering the durations and dependencies of activities, network diagrams enable project managers to estimate project timelines more accurately. This helps in setting realistic project schedules and managing stakeholder expectations.
-
Risk Identification and Mitigation: Network diagrams aid in identifying potential risks and bottlenecks within the project. By visually analyzing the critical path and identifying activities with zero float, project managers can proactively address risks and develop contingency plans.
Limitations of Network Diagrams
While network diagrams have numerous benefits, they also have some limitations that project managers should be aware of:
-
Complexity: Network diagrams can become quite complex for large and complex projects. Managing and updating the diagram may require significant effort and expertise.
-
Accuracy of Durations: The accuracy of network diagrams relies on accurate estimates of activity durations. Incorrect or optimistic duration estimates can lead to inaccurate project timelines and planning.
-
Lack of Dynamic Representation: Network diagrams offer a static representation of the project plan and do not account for real-time changes or updates. Project managers need to ensure regular updates to keep the diagram aligned with the current project status.
-
Limited in Agile Environments: Network diagrams may not be as relevant or practical in Agile project management environments, where the emphasis is on adapting to change and flexibility. Agile-specific tools and methodologies offer more dynamic and visual representations of work flows.
-
Dependency on Inputs: Network diagrams heavily rely on accurate and complete input data, including activity dependencies, durations, and milestones. Any inaccuracies or omissions in these inputs can affect the overall accuracy and effectiveness of the network diagram.
In conclusion, network diagrams are powerful tools in project management that provide a visual representation of a project’s activities, dependencies, and critical paths. They enhance project planning, coordination, and communication, aiding in accurate time estimation, efficient resource allocation, and risk identification. However, project managers should also consider the limitations of network diagrams and adapt them to suit the specific needs and methodologies of their projects.


